Customize NDepend Report
|
If you are new to NDepend reporting, before digging into report customization, it is recommended to:
|
Generate an NDepend Web Report from Your CI/CD Pipeline (5 minutes video)
Report Sections
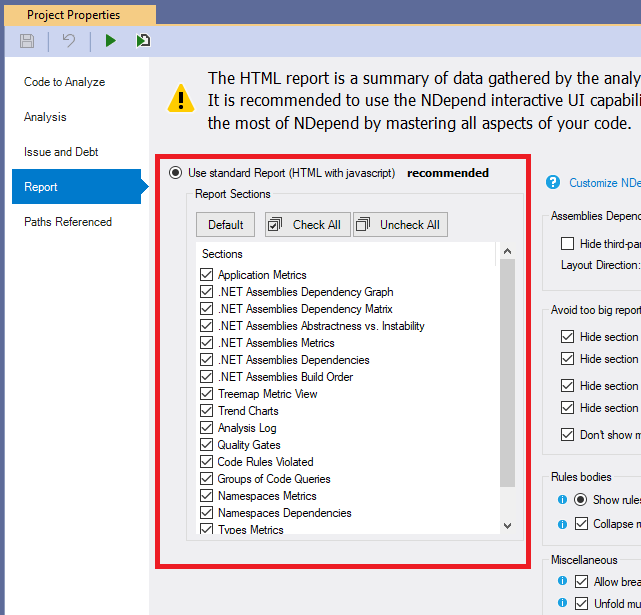
Report can be customized through the VisualNDepend or Visual Studio Extension > Project Properties > Report sub-panel. You can choose to activate many pre-defined sections like, Application and Assemblies metrics, some diagrams (dependencies, metrics, abstractness vs.instability…), CQLinq rules violation, and more.
Reporting Code Rules Violations
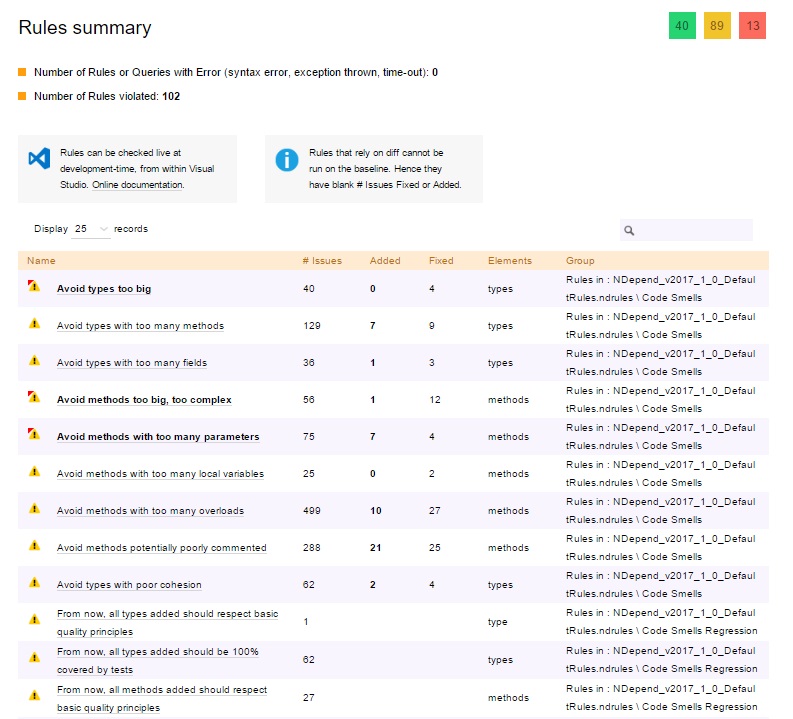
On the main page, the report contains a section titled Rules Summary.
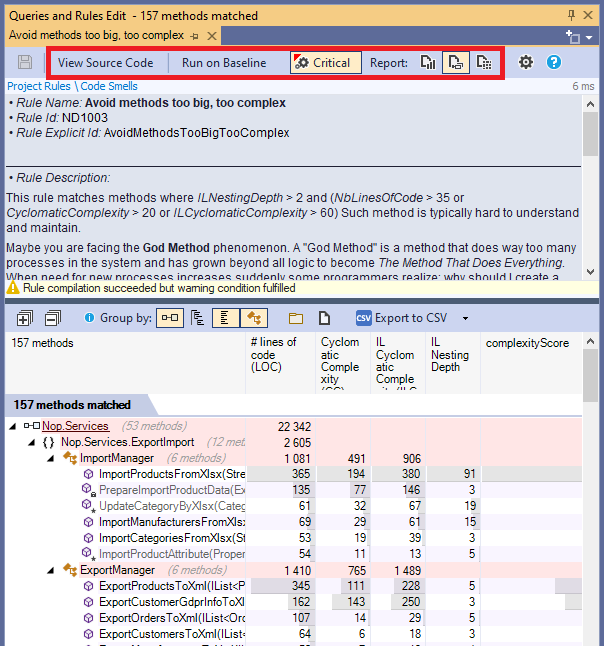
For each CQLinq rule you can choose whether you want to display issues in report (enabled per default), statistics about these issues (disabled per default) and a treemap based selection view of issues (disabled per default). A checkbox lets decide whether the rule is critical or not.
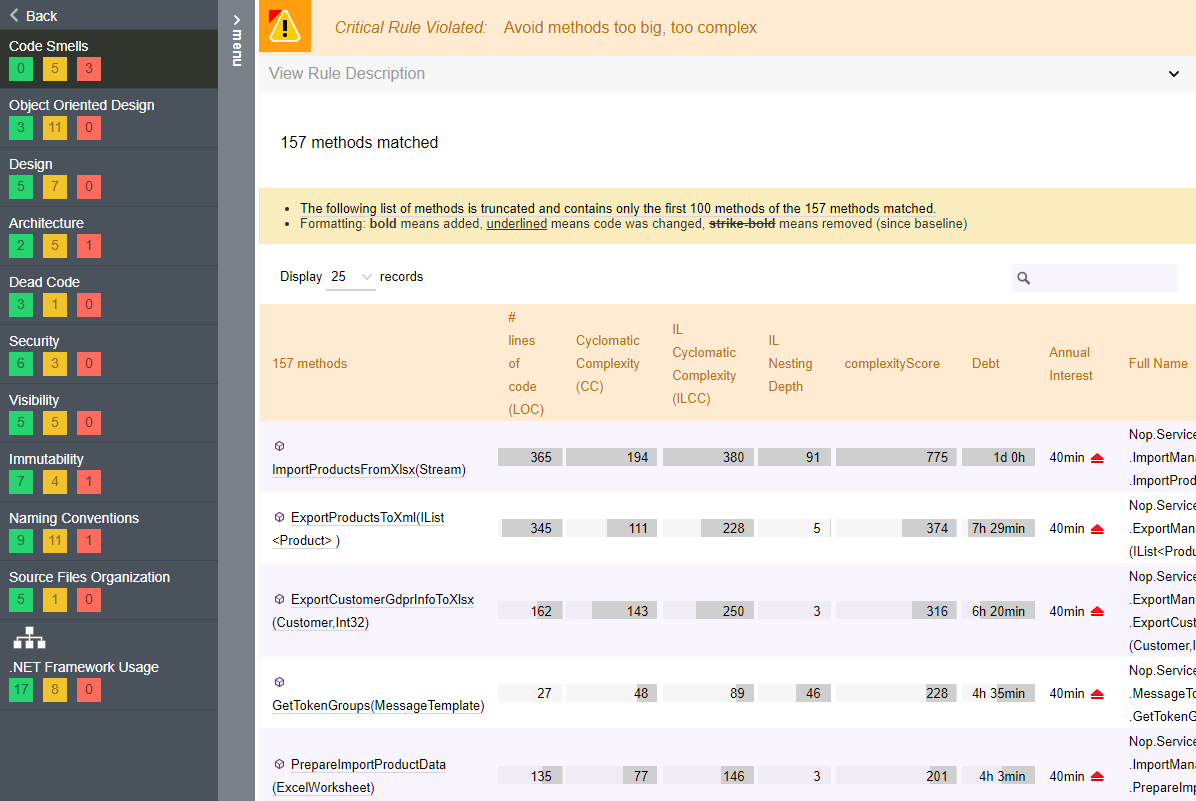
Here is what a CQLinq rule violated looks like in report:
Reporting groups of CQLinq Queries
Reporting the set of rules violated is useful, but it is also interesting to report some result sets of a few CQLinq queries. For example, you might want to write CQLinq queries to ask for methods and types added or refactored since the last release. And you might want to list these methods and types added or refactored in the report.
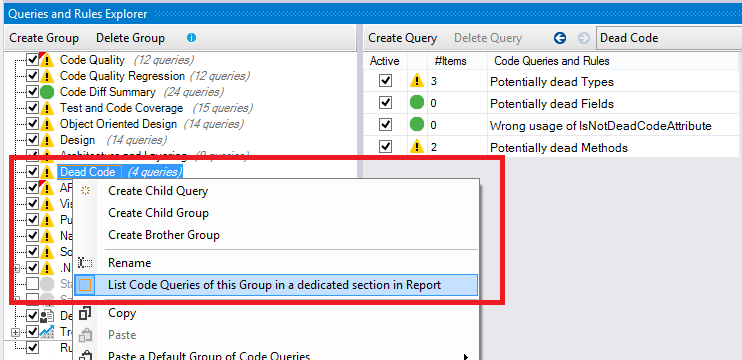
To do so, NDepend make possible to append extra report sections that lists these CQLinq queries. In the CQLinq Query Explorer panel, a particular CQLinq group reported is bordered with an orange rectangle.
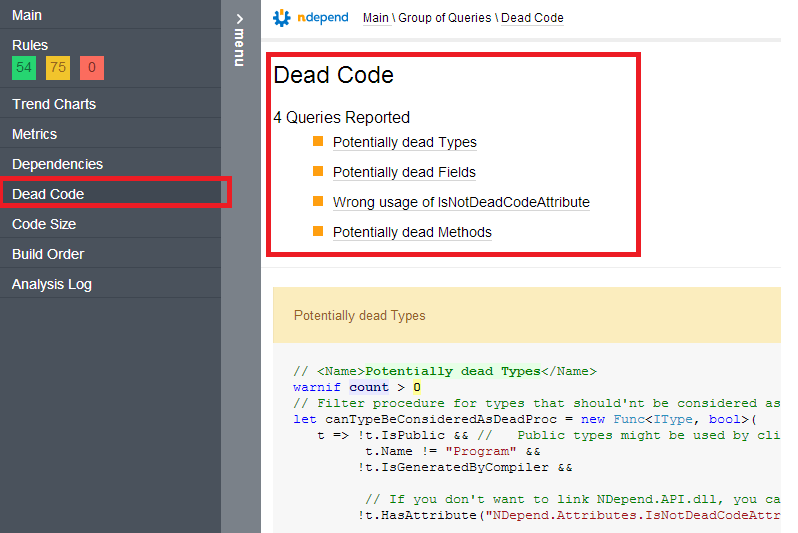
And here are the extra report sections:
Avoiding too large report
It is recommended to de-activate the Type Metrics and Type Dependencies sections since they can become pretty large if you have more than a thousand types in your application. Typically, browsing type metrics and dependencies is a scenario better addressed through the interactive UI.
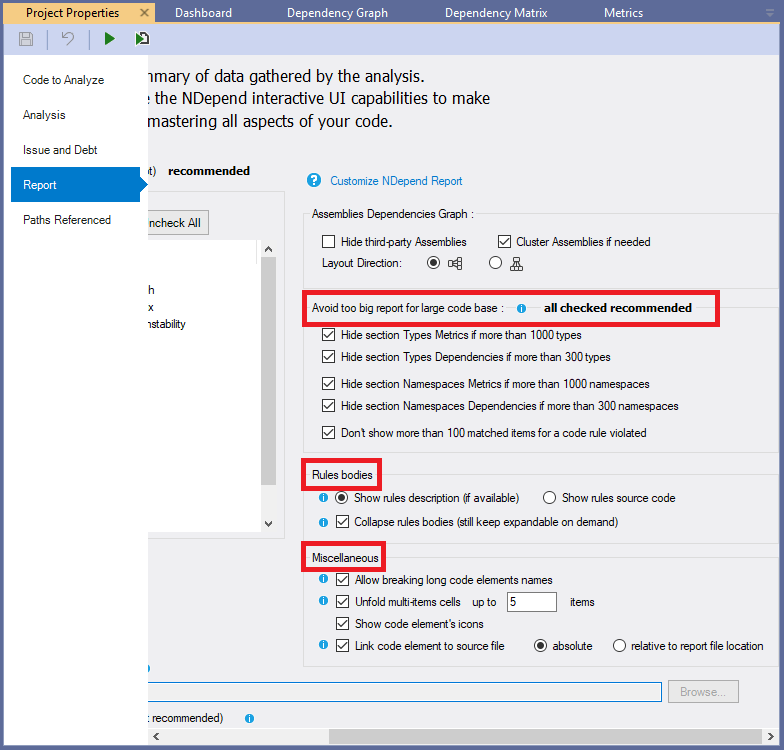
By default, NDepend sets a few flags on Project Properties to avoid too large reports:
Code Rules formatting
You can decide how to format code rules shown in the report (see the section Rules bodies in the screenshot above).
The rule source code contains the description in comments tags <Description>...</Description> and <HowToFix>...</HowToFix> (more info on description tag usage can be found here).
Hence showing rule source code is more informative, but also more verbose, since it contains also the logic applied to execute the rule.
Rule description is formatted and takes less space than the rule source code. It is also more readable for non-developers team members.
Notice that if a rule has no description, the source code is shown by default.
Miscellaneous report settings
There are more report settings in the Miscellaneous section in the screenshot above.
Allow breaking long code elements names:
Code elements names listed in code queries and rules results, in the report, can be very long. For example, the name of a method that has many parameters can have a length of hundreds of characters. If such long name is displayed in report, in a code query or rule result, this can harm formatting and make the entire result set unreadable.
By default, long names are broken.NDepend introduces some spaces in the long names at adequate position, before characters ( ) < > , .. Browsers can then rely on these extra spaces to break the long names on several smaller lines. You’ll notice that Goggle Chrome and Mozilla Firefox are especially good at computing breaks that render nicely. On the other hand, Microsoft Internet Explorer still shows too long pieces of lines despite the fact that it sometimes breaks lines.
You might want to disable the Allow breaking long code elements names option only if you are parsing somehow XML outputted code element names, and if extra spaces generated represent a problem for you.
Unfold multi-items cells: Some rules and code queries result's cells match several items (like several classes or several issues). When this flag is set, it unfolds up to N items.
Show code element's icons: to make the report more readable.
Link code element to source file:
When the source file declaration of a code element has been resolved at analysis time, with this setting checked it is possible to get a link to this declaration for each occurrence of the code element in the report.
The link to the source file declaration can be an absolute path or a path relative to the report file location.
When several declarations have been resolved, like for a class with multiple partial declarations or for a namespace declared in several files, one of these declarations is chosen randomly for the link.
Report Xml files
You can choose to build your own customized report by providing your own XSL sheet. It can be inspired from the one in $NDepend Install Dir$/BuildProcessResources/ReportXsl/NDependReport.xsl. Input information can be taken from the following XML files outputted by the analysis in the $AnalysisOutputDir$\XmlFilesUsedToBuildReport folder:
- ApplicationMetrics.xml
- Dashboard.xml
- AssembliesBuildOrder.xml
- AssembliesDependencies.xml
- AssembliesMetrics.xml
- NamespacesMetrics.xml
- NamespacesDependencies.xml
- TypesDependencies.xml
- TypesMetrics.xml
- InfoWarnings.xml
- CodeRuleResult.xml
- CodeRuleCriticalResult.xml
- CodeQueryResult.xml
The tickbox VisualNDepend or Visual Studio extension > Project Properties > Analysis > Keep XML files used to build reports and store warnings must be ticked, else these XML files get deleted by NDepend after the report is built.
