
NDepend Analysis
Introduction
NDepend gathers data from a code base. This includes quality code metrics, test coverage statistics, componentization/architecture/dependencies, evolution and changes, state mutability, usage of tier code and more.
The amount of data gathered is proportional to the size of the code base and can become pretty big in case of a large application analyzed. NDepend added value lies in its capabilities to let the user browse readily this huge amount of data. This way developers and architects can know precisely what's really happening inside their shop and can take decisions based on real facts, not based on intuition and rumor.
There are 2 distinct scenarios to browse data:
- Through a report: NDepend analysis process can be integrated into a build process and can produce a customizable HTML report each time the analysis is run. The is suited to produce daily dash-boards useful for every members of the team, even non-technical ones.
- Through the interactive UI (standalone with VisualNDepend.exe or the Visual Studio extension): The interactive UI comes with several panels to visualize and query interactively information about the code base. Interactive UI users are architects and developers that need to dig into details of the code base at any time during development time.
Let's expose here some details about how to integrate NDepend into a build process and customize analysis. Let's first explain how NDepend can provide useful warnings about the health of a build process.
Warnings about the health of the build process
These warnings can be found:
- in XML format in the file $AnalysisResultDir$\InfoWarnings.xml,
- in the report section NDepend information and warnings,
- in the panel NDepend Error List in the interactive UI.
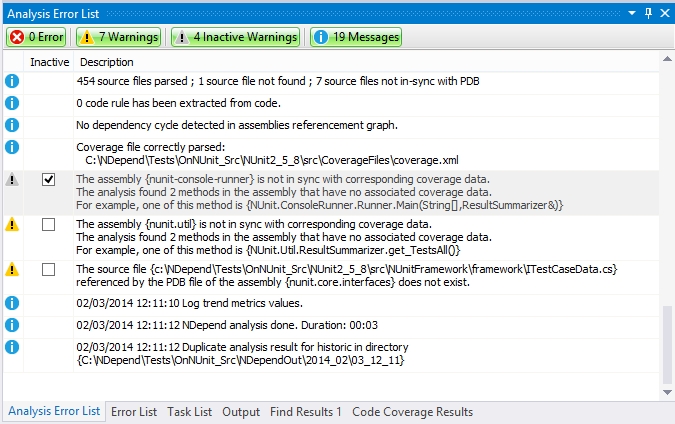
What we mean by the health of the build process is some details that can reveal potential flaws. Concretely this includes:
Assemblies versioning issues such as:
- AssemblyA references AssemblyB v2.1 but only AssemblyB v2.0 is available.
- AssemblyA references 2 versions of AssemblyB (which is not necessarily a bad thing, but it's still useful to be aware of such situation).
Assembly conflicts such as:
- The name of my assembly main module file is different from the logical name of my assembly.
- Several different assemblies with the same name can be found (different = different hash code and/or different version).
PDB files issues such as:
- Missing PDB files.
- PDB files and code source files not in-sync.
- PDB files and assemblies are not in-sync.
Coverage files issues such as:
- Corrupted or missing coverage files.
- Coverage files and code source files not in-sync.
- Coverage files and assemblies are not in-sync.
In the Error List panel of the interactive UI you have the possibility to deactivate false warnings to avoid being warned again and again during future analysis.
Running an Analysis with NDepend.Console.exe
NDepend comes with 4 executables:
- NDepend.Console.exe to run an analysis.
- VisualNDepend.exe a standalone executable to run interactive UI.
- NDepend.Install.VisualStudioAddin.exe to install/uninstall the NDepend Visual Studio addin, to have access to interactive UI features from within Visual Studio.
- NDepend.PowerTools.exe open-source tools based on NDepend.API compiled from the Visual Studio solution: $NDependInstallPath$\NDepend.PowerTools.SourceCode\NDepend.PowerTools.sln.
NDepend.Console.exe is a classic console executable that takes command line arguments. The only required input is an absolute path to the NDepend project file (extension .ndproj) that defines the code base to be analyzed. Several command line arguments can be provided and they are listed here: NDepend.Console.exe. Basically these arguments will let you override folders where assemblies to be analyzed are stored, override the output folder where data produced by the analysis will be persisted and provide a XSL sheet to customize the report.
A simple exec command is needed to integrate NDepend.Console.exe into your build process. More documentation is available concerning the integration of NDepend with different build technologies:
- Azure DevOps and TFS
- GitHub Action
- TeamCity
- Jenkins
- Bamboo
- AppVeyor
- SonarQube
- CruiseControl.NET
- FinalBuilder
- Critical Rules
Analysis Options
To handle real-world scenarios, there are several analysis options. Options can be tuned through the VisualNDepend or Visual Studio addin > Project Properties panel. Options are then persisted into the NDepend project file (extension .ndproj) and can be used at analysis time.
The tab Code to Analyze lets you choose the assemblies analyzed but also the directories that contains them. Analyzed assemblies include both your own assemblies, but also third-party assemblies that are used by your application (like mscorlib.dll or Log4Net.dll).
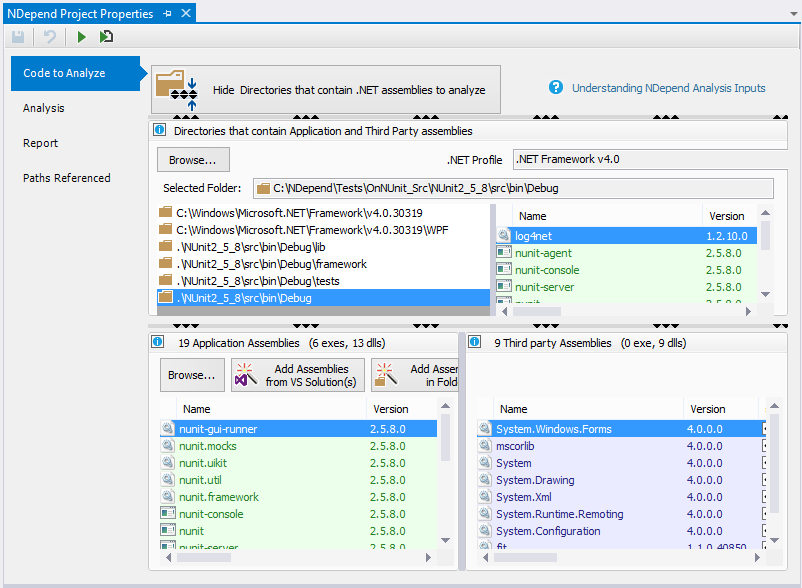
In the screenshot above you'll notice that directories containing .NET Framework assemblies are absolute. These directories are always absolute and NDepend automatically adapts folders path from the current machine's .NET Framework installation.
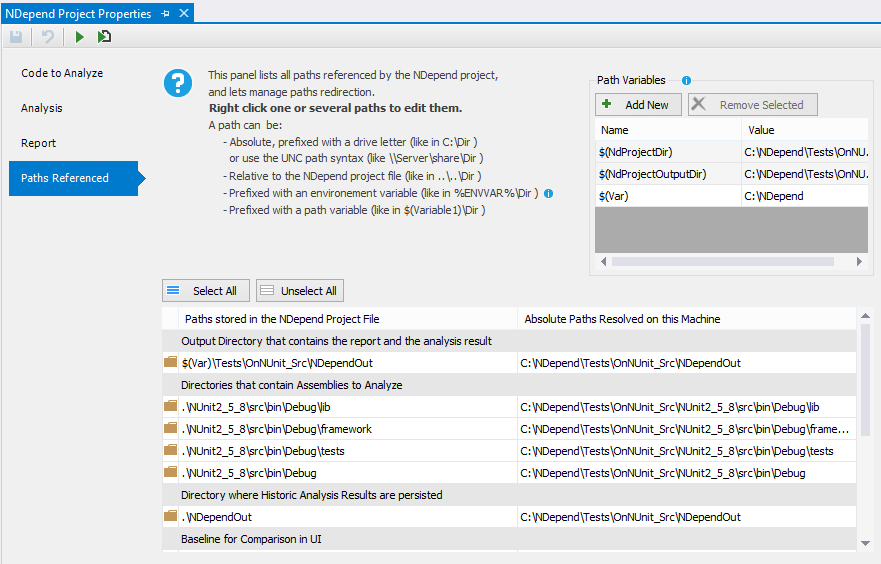
You'll notice also that directories that contains application assemblies are relative. The Project Properties tab Paths Referenced (below) lets choose how paths are stored and offer several options to redirect paths. This is useful when the same project file is used in different context on different machine. Each path can be:
- Absolute, prefixed with a drive like like C:\ or use the UNC path syntax like \\Server\Share
- Relative to the NDepend project file location, like ..\..\Dir
- Prefixed with an environment variable, like %ENVVAR%\Dir
- Prefixed with a path variable, like $(Variable)\Dir. Path variables can be defined in project file and what make them very useful, is that they can be overriden at analysis time through the command line option /PathVariables Name1 Value1 [Name2 Value2 ...] of NDepend.Console.exe.
In the VisualNDepend or Visual Studio extension > Project Properties > Analysis sub-panel, you'll find several interesting options beside the project name and output folder.
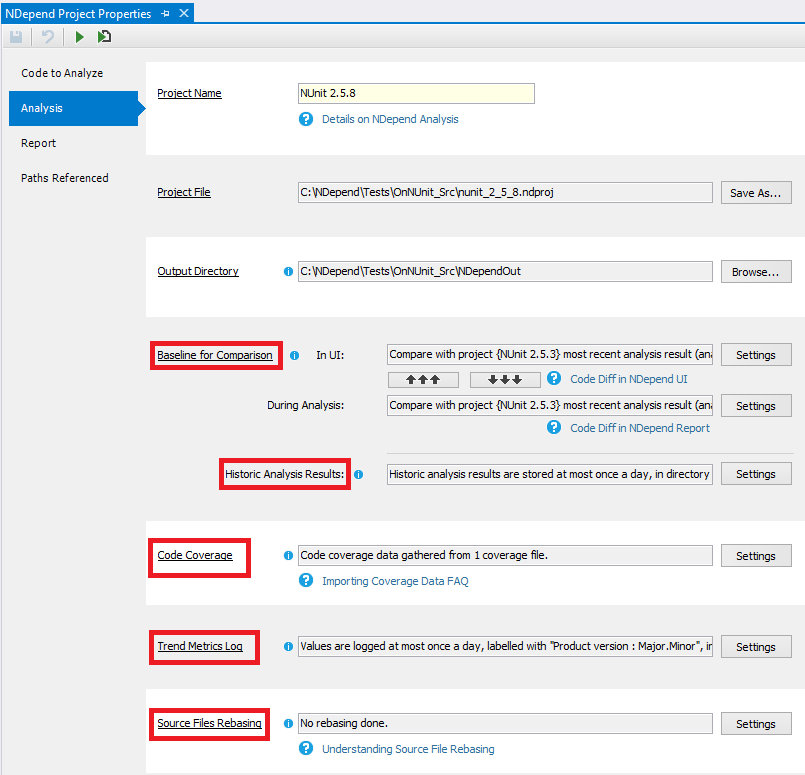
The Baseline for Comparison option lets define the previous analysis result on which to compare the current analysis performed (or the current analysis result loaded in interactive UI). This is useful if you've defined some CQLinq rules about evolution of your code base like for example, making sure that all new or refactored methods are 100% covered by tests (More information about this can be found here: Reporting Code Diff) :
warnif count > 0
from m in Application.Methods where
  (m.WasAdded() || m.CodeWasChanged()) &&
   m.PercentageCoverage < 100
select new { m, m.PercentageCoverage }
Basically, here (m.WasAdded() || m.CodeWasChanged()) means was added or refactored compare to the baseline. The baseline for comparison can be:
- a particular result (like the analysis of the last release we've made),
- a result made N days ago
- or the last analysis result available.
Below, you'll find details to detect CQLinq result violations in the report.
The Historic Analysis Results option lets define the location where historic analysis results are stored. Historic analysis results are useful to diff the current snapshot of the code base with a previous one. This option lets also choose the frequency for saving analysis results (at most once a day, a week ...).
The Trend Metrics Log option lets define the frequence of trend metrics log, and also the location where the are saved. More about this in the Trend Metrics Monitoring section.
The Code Coverage option lets specify the NCover, NCrunch, dotCover, OpenCover or VisualStudio XML coverage file(s) from which NDepend will gather test coverage statistics. More details about how to obtain these coverage files can be found in the NDepend documentation Coverage FAQ
The Source File Rebasing option is useful if the code compilation and the NDepend analysis are executed on different machine. NDepend gathers information from the assemblies, but also from the source files if they are available. NDepend knows about source files from the PDB files produced by the compilation. PDB files contain absolute paths to source files. PDB files are initially used by the debugger to link IL compiled code with source files code. If the code compilation and the NDepend analysis are executed on 2 different machines, it might happen that source files locations are different between the 2 machines. In this case absolute source files paths contained in the PDB files should be rebased, hence the need for the Source File Rebasing option. More information about source files rebasing can be found here: Source Files Rebasing